

Introduction
The goal of this independent study was to create algorithms based on my knowledge from the 4041 and 5421 algorithms. By doing this I hoped to achieve a better understanding of the algorithms themselves, learn what is required to visualize a complicated process such as an algorithm, and finally, determine whether I could use the visualizations as a tool to understand unknown algorithms. This involved first implementing the algorithms in Javascript, then instrumenting them to output their state, and finally visualizing and animating these states. I used the D3 library to bind data to SVG elements, layout the trees and graphs, and animate the transitions.
In the following sections I will discuss in detail parts of the system, and individual algorithms. In the end of this report, I will conclude with my overall experiences, and lessons learned.
Table of Contents
General Discussion
Structure
All the visualizations are broken up into 3 main parts: 1) The algorithm implementation , 2) Instrumentation inside the algorithm which captures data about the state, and saves it to an animation array, and 3) The visualization , which takes the animation array data and uses it to generate and update the visualization. The visualization code is included in a separate file for organizational purposes
I wanted the instrumentation to be very simple, so existing algorithms could easily be converted to visualizations without changing the structure of the code. I imagined even using the visualizations to understand algorithms I wasn't familiar with. Creating the visualization ended up being more complex than this, but this loosely coupled system worked out well overall. For example, in the priority queue I instrumented the "swap()" method with the object {"type":"swap", elements:[location1,location2]}. After testing the individual pieces I ran buildHeap() method any everything worked!
This structure worked very well for prims algorithm, and fairly well for merge sort. The recursive implementation of merge sort made it slightly harder to cleanly instrument. I'll discuss this later in the Merge Sort section.
D3 (Data Driven Documents)
I used the D3 library to layout and animate all the visualizations. D3 (data driven documents) is a library for binding data to SVG graphics, and also laying out many data structures including trees, graphs, maps etc. The layouts themselves do not generate SVG's, but instead provide simple information that greatly simplifies generation, without limiting what's possible. For example, the tree layout takes a graph and outputs x and y coordinates. These coordinates can then be interpreted literally to create a traditional tree layout, or another way, like radially.
My experience with d3 was generally very good, with the exception of some difficult to debug errors. The general pattern used to bind data to SVG elements is to select the elements using d3.select(), bind data to the selection using selection.data(), and then operate separately on the new or "entering" elements (data without an SVG), the existing elements (data with an SVG) and the "exiting" elements (SVGs without data). The data is stored in the DOM as the __DATA__ property of an SVG element. Initially in my priority queue visualization I assumed the data in the DOM was linked to the data specified to create it. This is not the case, and led to a confusing problem when where the nodes were not updating correctly.
Recently the creator of D3 wrote a great article describing how selections and data binding works in detail.
Animation
The visualization animation is accomplished using an animation array containing objects which represent snapshots in the algorithm's execution, and a series of animation methods, which inspect the animation array and execute corresponding functions.
Individual objects in the animation array can be executed with the execute() method. This checks the type property, which corresponds to a case statement. When the visualization only requires simple modification, such as marking a node with a different color to emphasize it, the code is contained in the case statement itself. If more extensive manipulation is necessary a function can be defined externally and executed.
Successive animation objects can be evaluated with the animate() function. This was the most tricky part to implement. To animate an action object at some time in the future, a window.setTimeout() call can be used. This is executed in the global scope however, so when multiple objects are executed in a series, a closure is necessary to capture the index of the animation object. To execute single actions followed by a series of actions I store currentAction index. Animations can be paused by storing the setTimeout() id in an array and canceling all events with a clearTimeout() call to all events.
This system works well for simple animations, but in the future I plan to add several practical enhancements. When executing many actions at a time, like in the buildHeap() method of the priority queue, many similar swap actions are animated in series. This can be tiring to watch, and would be much better if the swaps of a particular level overlapped. Setting the transitionTime variable to longer than the period of animation can accomplish this, but then the swaps on lower depths will conflict. Adding "overlap" and "hold" properties to the action object and computing the sequences in advanced could potentially solve this. Another problem occurs when animations are executed very quickly. This is desirable when showing a long process like build heap, but can cause animations to drop, resulting in an incorrect visualization state. If I implement a similar system in the future, I plan on caching all states in the animation beforehand. This would allow the state to be corrected after each action.This type of system would also allow an undo function to be implemented fairly easily.
Each individual animation is executed by a D3 transition. By appending a .transition() call to a selection, all changes will be interpolated from one value to another. This interpolation even handles data embedded in text, like SVG transform:translate(0,30) attributes used to transform group SVG elements.
Specific Algorithm Discussion
Priority Queue
view codeThe priority queue was the first algorithm, or data structure, I visualized. I implemented it in Javascript using a binary heap method similar to the one in "Introduction to Algorithms." At first I used an object orientated approach very similar to the book code, but in practice this was fairly verbose. Instead, I created a new version using two arrays held in sync for keys and data. This was my first time implementing a binary heap in practice, and writing the actual code greatly improved my comprehension of the algorithm details.
Prims Algorithm
view codePrims Algorithm was the second algorithm I visualized. I used a similar implementation to the book's, and the algorithm coding went fairly smoothly. I was even able to use my priority queue for the open list.
The most difficult part of writing prims algorithm was generating the graph. Prims algorithm finds minimum spanning trees which have no cycles, and are of lightest possible weight. To show the no cycles property, the initial graph needs cycles, or the contrast between input and output graphs is not apparent. To create these I created a system which randomly added edges to an array of vertexes until some maximum number was reached. Representing the minimum weight property was harder to solve. At first I experimented with randomly plotting points in 2d space, and then connecting them to provide geometrically accurate edge weights. This worked, but the resulting graph looked messy and confusing. My final solution uses the build-in force layout of D3. It uses a constraint relaxation method to simulate the vertexes as particles. This produced a very uniform graph with minimal overlapping, but the physical edge length could no longer be used to represent weight. To solve this I plotted text values for all the weights at the center-point of each edge.
Merge Sort
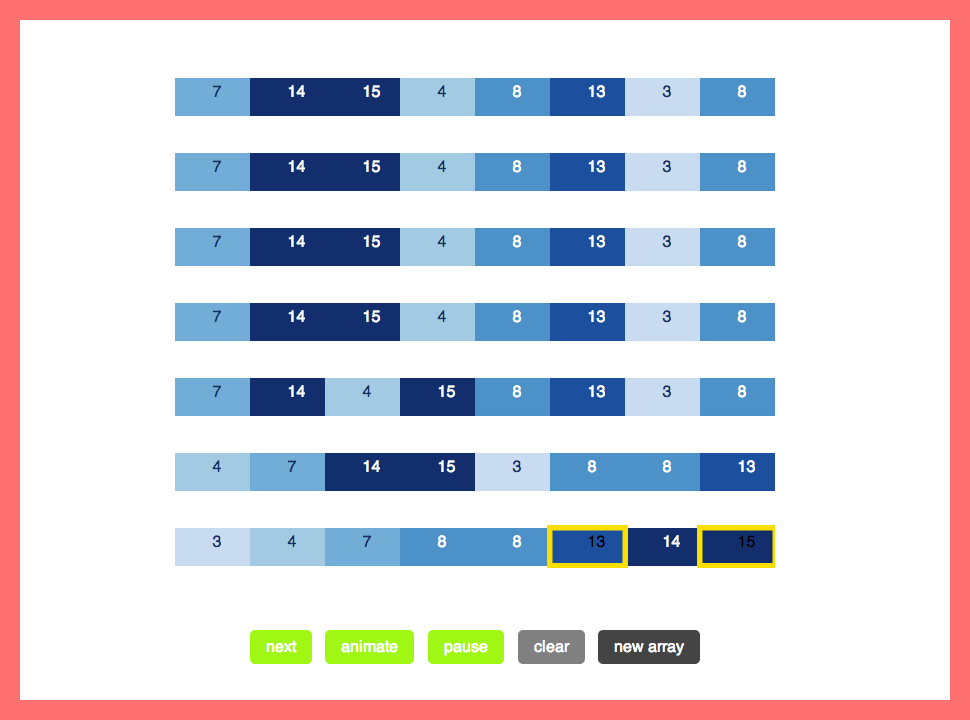
view codeMerge sort was the last algorithm I visualized. Initially I assumed this would be fairly easy, due to its rectangular visual structure, but it's recursive nature provided some interesting challenges. In contrast to the first algorithms, I implemented merge sort without the aid of the book. The general idea of the algorithm is fairly simple, but while implementing it in Java script, my habit of not declaring var was a big problem. The values of parent merge sort functions interfered with children and produced several confusing bugs before I found the source.
The recursion also provided a challenge when instrumenting the algorithm. For simplicity I chose to pass new halved arrays into the merge function, instead of using indexes. This made the code easier to read, but required that extra parameters be passed. Additionally a depth parameter not used by the algorithm had to be passed to indicate the level of recursion.
The visualization component of this algorithm was the most fun and educational to implement. Prior to this visualization, I had never considered the traversal order of merge sort. Textbooks and visualizations I found on the internet always display the algorithm dividing and merging all arrays at a given depth before proceeding to the next level (breadth first). I knew this was not the case in my recursive implementation, but the idea that this recursion corresponded to a depth first traversal hadn't occurred to me before. It was very fun to see this realization come from my own visualization.
Conclusion
Overall this independent study was very useful for learning more about algorithms, creating visualizations, and improving my general software engineering skills. These visualizations were the largest single project I have designed myself. In most class projects the scope is much smaller, and most of the large design decisions and requirements are determined in advance, by an instructor. This independent study was the opposite, and forced me to learn a lot about software design. Prior to this semester I primarily wrote code on my computer, and made most design choices in a more linear way. During this project I found myself sketching designs and structures in my notebook and avoiding many tricky problems without any coding.
One of the most surprising things about creating these visualizations was how much I learned about about the algorithms themselves. Although I knew the basic mechanical operations, many deeper concepts I did not understand well. Seeing the algorithms visually helped me understand the relationships between many algorithms that I originally considered totally separate (like greedy best first search and prims algorithm). This semester I graduate, but I plan to continue visualizing various processes in the hopes of understanding them more deeply. This independent study was a very fun and insightful departure my traditional coursework, and I hope I can continue learning about computer science this way in the future.